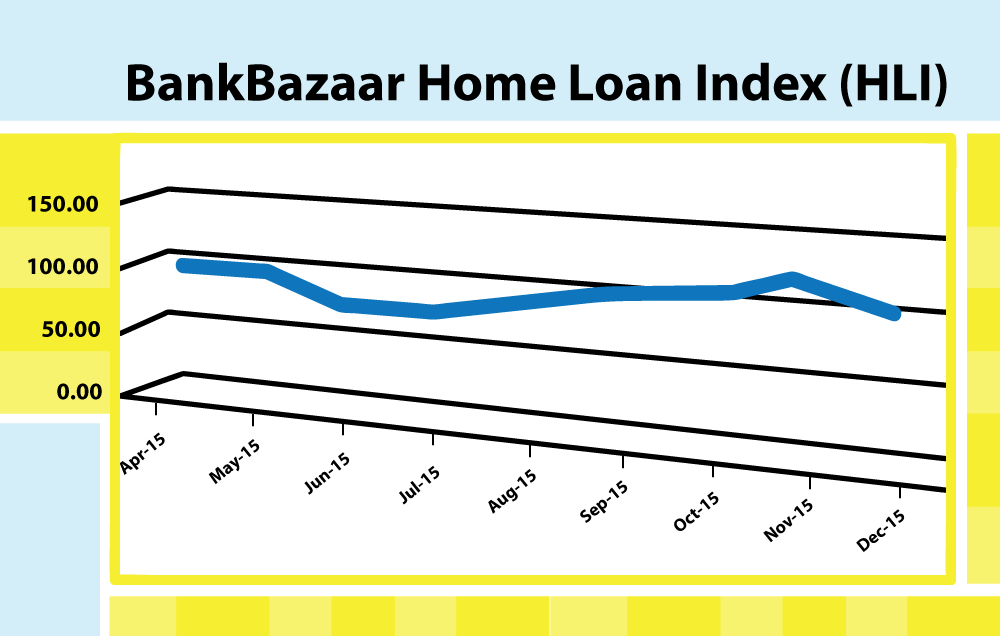
The BankBazaar Home Loan Index (HLI), an indicator that measures home loan activity in India, has seen a dip below 100 in the period between May 2015 and August 2015. Subsequently, it has been on a broadly increasing trend since September 2015 and continued this way for the remainder of the calendar year.

As of December 2015, the BankBazaar HLI stood at 106, compared to a reference value of 100 as of April 2015.
A decrease in the average interest rate on applications in the Oct-Dec period is one of the reasons for the increase in the application submissions in said period.
The average loan value applied for in the last 1 year is 23 Lakhs.
Across demographics, the average monthly income of the applicants was 65K, the average age was 34 years, and the average interest rate was 9.94% for the last 1 year.
The percentage of mobile applications has increased from 17% in Apr to 22% in Dec.
City-wise summary:
On an aggregate level, Bangalore and Mumbai have been the top cities across the 4 Index parameters—application submissions, application disbursals, average loan value, and total loan value. The top 10 cities contribute approximately 70% of the total application submissions and disbursals.
The average loan value of Bangalore applicants is Rs.30 Lakhs vis-à-vis Surat which is Rs.18 Lakhs. If you look at demographic factors, for instance, the average monthly income of Bangalore applicants is approximately Rs. 91,000 whereas Surat’s average monthly income is approximately Rs.41,000.
Methodology for calculation of the index
The BankBazaar Home Loan Index (HLI) is a financial indicator that provides individuals and lenders operating in the home loan segment with insights on the dynamics of Home Loan demand and supply. It is an indicator of the Home Loan activity in India and the broad trends prevailing in the Home Loan market.
The index is calculated by taking into account all the Home Loan applications and aggregating it at a city and national level. The parameters used in calculating the Home Loan Index are applications submitted, applications disbursed, average loan value, total loan value and % growth Quarter-on-Quarter (QoQ) of applications disbursed.
The month of April 2015 is taken as the reference month for an Index score of 100. The insights are derived based on statistical calculations, industry knowledge, and logical interpretations.
The top 10 cities have also been analysed separately to uderstand the city-wise contribution to the overall index. This helps lenders and customers to get a better understanding of the market, thereby facilitating informed decision-making.
The Home Loan Index movement is broadly in line with the market trends. Hence, this can be considered as a representation of the market.
looking for a land/plot/site loan which is going good on rate of interest, no prepayment fees, no or little binding on construction commencement.
If you are can call, can discuss.
Hi Chandrasekhar,
Please click here to check the eligibility for a loan.
Cheers,
Team BankBazaar
Can we get the full report?
Also is the analysis based on loan applications only on Bankbazaar or across all the financial institutions in India?
Thanks and Regards
Chintan Shah
Hi Chintan,
Thank you for visiting our blog. In response to your question, yes, this article is based on BankBazaar and no, unfortunately, the full report is not available.
Cheers,
Team BankBazaar